 All popular blogging platforms and Content Management Systems (CMS) like Drupal, Wordpress and Joomla make extensive use of database back-end and having a fine-tuned database server is crucial to achieve optimal performance on these. As the saying goes "one size does not fit all" the default my.cnf which comes with MySQL server needs fixing as per your scripts requirements and hardware configuration, thankfully we do have free tools to get this done effectively and easily.
Today, I will be showing two scripts and a simple tip which will help us optimize our databases to achieve maximum performance - before proceeding do keep in mind that this is quite advanced as it requires editing database configuration files and working via shell access to linux root on your server.
First of all, I will tell you a simple procedure which you should perform regularly on your databases to achieve optimal performance, MySQL supports a OPTIMIZE TABLE command which is used to de-fragment mysql tables and is specially useful for tables which are frequently updated and/or deleted. Using OPTIMIZE TABLE command basically repairs/rebuilds a table bringing down it's size on disk if de-fragmented resulting in better performance, here is how you can do this using phpMyAdmin interface.
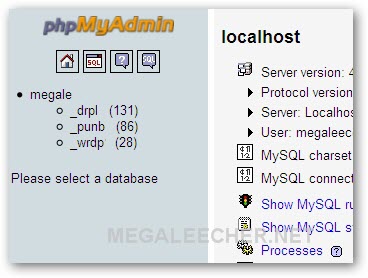
- Launch phpMyAdmin and select a database.
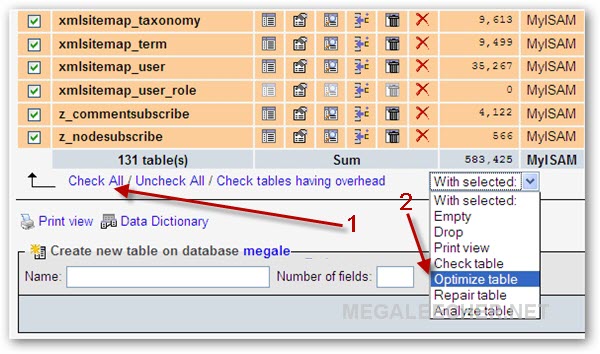
- All tables from the selected database will get listed on left-side frame, scroll to the bottom of the frame and click Check All link now select Optimize Table option from the With Selected drop-down box and the command will get executed.
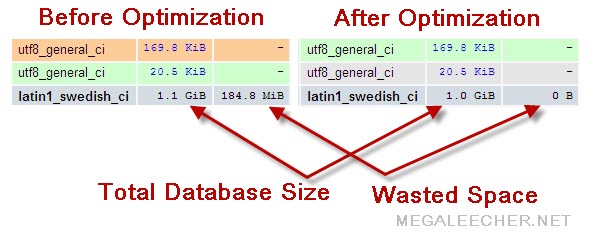
- Here are my results, notice how this simple command recovered 184.8 MB of wasted database disk-space.
Now, we will use two free database tuning scripts mysqltuner.pl and tuning-primer.sh to find the optimal configuration for our MySQL server installation, unlike the above procedure this needs to be done only once.
- Log into your server console as root and execute the following commands to download both scripts.
- Now, we need to make these scripts executable - use the following commands to do so.
- We will now run the scripts one by one.
- This will result in a report like this :
- Save the above output and execute the second script.
- This will result in a report like this :
- Save this report and act on the recommendations from both scripts to edit your MySQL configuration file my.cnf to achieve best performance, you can also post these reports on webhosting/MySQL support forums to receive expert recommendations on further optimizing your database.
chmod +x mysqltuner.pl
chmod u+x tuning-primer.sh
./mysqltuner.pl
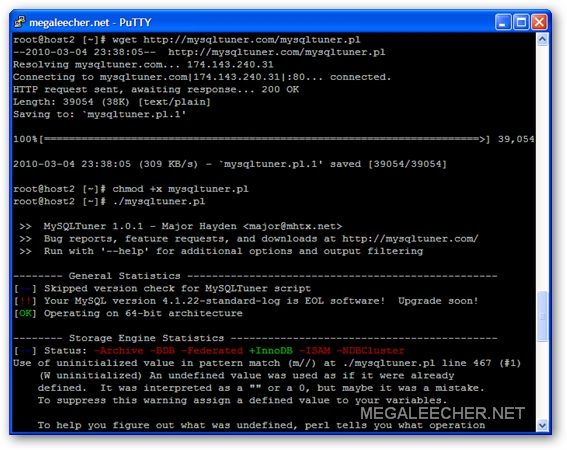
Here is the script output :
>> MySQLTuner 1.0.1 - Major Hayden
>> Bug reports, feature requests, and downloads at http://mysqltuner.com/
>> Run with '--help' for additional options and output filtering-------- General Statistics --------------------------------------------------
[--] Skipped version check for MySQLTuner script
[OK] Operating on 64-bit architecture-------- Storage Engine Statistics -------------------------------------------
[--] Status: -Archive -BDB -Federated +InnoDB -ISAM -NDBCluster
Use of uninitialized value in pattern match (m//) at ./mysqltuner.pl line 467 (#1)
(W uninitialized) An undefined value was used as if it were already
defined. It was interpreted as a "" or a 0, but maybe it was a mistake.
To suppress this warning assign a defined value to your variables.To help you figure out what was undefined, perl tells you what operation
you used the undefined value in. Note, however, that perl optimizes your
program and the operation displayed in the warning may not necessarily
appear literally in your program. For example, "that $foo" is
usually optimized into "that " . $foo, and the warning will refer to
the concatenation (.) operator, even though there is no . in your
program.Use of uninitialized value in hash element at ./mysqltuner.pl line 468 (#1)
Use of uninitialized value in hash element at ./mysqltuner.pl line 472 (#1)
Use of uninitialized value in hash element at ./mysqltuner.pl line 473 (#1)
Use of uninitialized value in numeric gt (>) at ./mysqltuner.pl line 475 (#1)
Use of uninitialized value in hash element at ./mysqltuner.pl line 469 (#1)
Use of uninitialized value in hash element at ./mysqltuner.pl line 470 (#1)
[--] Data in tables: 0B (Tables: 283)
[--] Data in INNODB tables: 1G (Tables: 572)
[--] Data in InnoDB tables: 160K (Tables: 6)
[--] Data in HEAP tables: 0B (Tables: 1)
[!!] Total fragmented tables: 35-------- Performance Metrics -------------------------------------------------
[--] Up for: 4d 14h 53m 56s (152M q [381.144 qps], 520K conn, TX: 374B, RX: 74B)
[--] Reads / Writes: 87% / 13%
[--] Total buffers: 162.0M global + 9.2M per thread (500 max threads)
[OK] Maximum possible memory usage: 4.6G (39% of installed RAM)
[OK] Slow queries: 0% (4/152M)
[OK] Highest usage of available connections: 5% (27/500)
[OK] Key buffer size / total INNODB indexes: 64.0M/38.7M
[OK] Key buffer hit rate: 100.0% (490M cached / 123K reads)
[OK] Query cache efficiency: 92.5% (137M cached / 148M selects)
[!!] Query cache prunes per day: 1328258
[OK] Sorts requiring temporary tables: 0% (209 temp sorts / 782K sorts)
[OK] Temporary tables created on disk: 17% (107K on disk / 608K total)
[OK] Thread cache hit rate: 99% (27 created / 520K connections)
[!!] Table cache hit rate: 15% (675 open / 4K opened)
[OK] Open file limit used: 1% (1K/65K)
[OK] Table locks acquired immediately: 99% (15M immediate / 15M locks)
[OK] InnoDB data size / buffer pool: 160.0K/8.0M-------- Recommendations -----------------------------------------------------
General recommendations:
Run OPTIMIZE TABLE to defragment tables for better performance
Increase table_cache gradually to avoid file descriptor limits
Enable concurrent_insert by setting it to 'ON'
Variables to adjust:
query_cache_size (> 64M)
table_cache (> 32512)
./tuning-primer.sh
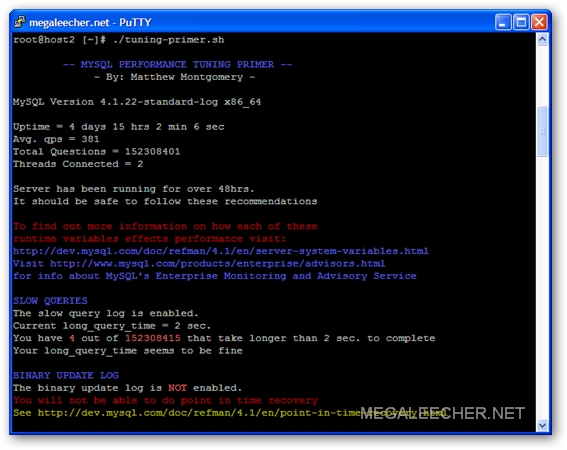
Here is the script output :
-- MYSQL PERFORMANCE TUNING PRIMER --
- By: Matthew Montgomery -MySQL Version 4.1.22-standard-log x86_64
Uptime = 4 days 15 hrs 2 min 6 sec
Avg. qps = 381
Total Questions = 152308401
Threads Connected = 2Server has been running for over 48hrs.
It should be safe to follow these recommendationsTo find out more information on how each of these
runtime variables effects performance visit:
http://dev.mysql.com/doc/refman/4.1/en/server-system-variables.html
Visit http://www.mysql.com/products/enterprise/advisors.html
for info about MySQL's Enterprise Monitoring and Advisory ServiceSLOW QUERIES
The slow query log is enabled.
Current long_query_time = 2 sec.
You have 4 out of 152308415 that take longer than 2 sec. to complete
Your long_query_time seems to be fineBINARY UPDATE LOG
The binary update log is NOT enabled.
You will not be able to do point in time recovery
See http://dev.mysql.com/doc/refman/4.1/en/point-in-time-recovery.htmlWORKER THREADS
Current thread_cache_size = 256
Current threads_cached = 25
Current threads_per_sec = 0
Historic threads_per_sec = 0
Your thread_cache_size is fineMAX CONNECTIONS
Current max_connections = 500
Current threads_connected = 2
Historic max_used_connections = 27
The number of used connections is 5% of the configured maximum.
You are using less than 10% of your configured max_connections.
Lowering max_connections could help to avoid an over-allocation of memory
See "MEMORY USAGE" section to make sure you are not over-allocatingINNODB STATUS
Cannot parse InnoDB stats prior to 5.0.x
*************************** 1. row ***************************
Status:
=====================================
100304 23:46:30 INNODB MONITOR OUTPUT
=====================================
Per second averages calculated from the last 54 seconds
----------
SEMAPHORES
----------
OS WAIT ARRAY INFO: reservation count 8, signal count 8
Mutex spin waits 9, rounds 42, OS waits 2
RW-shared spins 8, OS waits 4; RW-excl spins 2, OS waits 2
------------
TRANSACTIONS
------------
Trx id counter 0 9989
Purge done for trx's n:o < 0 4383 undo n:o < 0 0
History list length 9
Total number of lock structs in row lock hash table 0
LIST OF TRANSACTIONS FOR EACH SESSION:
---TRANSACTION 0 0, not started, process no 13130, OS thread id 1153833280
MySQL thread id 521211, query id 152308716 localhost root
SHOW /*!50000 ENGINE */ INNODB STATUS
--------
FILE I/O
--------
I/O thread 0 state: waiting for i/o request (insert buffer thread)
I/O thread 1 state: waiting for i/o request (log thread)
I/O thread 2 state: waiting for i/o request (read thread)
I/O thread 3 state: waiting for i/o request (write thread)
Pending normal aio reads: 0, aio writes: 0,
ibuf aio reads: 0, log i/o's: 0, sync i/o's: 0
Pending flushes (fsync) log: 0; buffer pool: 0
41 OS file reads, 8 OS file writes, 8 OS fsyncs
0.00 reads/s, 0 avg bytes/read, 0.00 writes/s, 0.00 fsyncs/s
-------------------------------------
INSERT BUFFER AND ADAPTIVE HASH INDEX
-------------------------------------
Ibuf for space 0: size 1, free list len 0, seg size 2, is empty
Ibuf for space 0: size 1, free list len 0, seg size 2,
0 inserts, 0 merged recs, 0 merges
Hash table size 17393, used cells 0, node heap has 0 buffer(s)
0.00 hash searches/s, 0.00 non-hash searches/s
---
LOG
---
Log sequence number 0 226501
Log flushed up to 0 226501
Last checkpoint at 0 226501
0 pending log writes, 0 pending chkp writes
11 log i/o's done, 0.00 log i/o's/second
----------------------
BUFFER POOL AND MEMORY
----------------------
Total memory allocated 21816488; in additional pool allocated 874496
Buffer pool size 512
Free buffers 470
Database pages 42
Modified db pages 0
Pending reads 0
Pending writes: LRU 0, flush list 0, single page 0
Pages read 42, created 0, written 1
0.00 reads/s, 0.00 creates/s, 0.00 writes/s
No buffer pool page gets since the last printout
--------------
ROW OPERATIONS
--------------
0 queries inside InnoDB, 0 queries in queue
Main thread process no. 13130, id 1152428352, state: waiting for server activity
Number of rows inserted 0, updated 0, deleted 0, read 4
0.00 inserts/s, 0.00 updates/s, 0.00 deletes/s, 0.00 reads/s
----------------------------
END OF INNODB MONITOR OUTPUT
============================Current innodb_buffer_pool_size = 8 M
Depending on how much space your innodb indexes take up it may be safe
to increase this value to up to 2 / 3 of total system memoryMEMORY USAGE
Max Memory Ever Allocated : 385 M
Configured Max Per-thread Buffers : 4.48 G
Configured Max Global Buffers : 138 M
Configured Max Memory Limit : 4.61 G
Physical Memory : 11.72 G
Max memory limit seem to be within acceptable normsKEY BUFFER
Current INNODB index space = 38 M
Current key_buffer_size = 64 M
Key cache miss rate is 1 : 3954
Key buffer free ratio = 54 %
Your key_buffer_size seems to be fineQUERY CACHE
Query cache is enabled
Current query_cache_size = 64 M
Current query_cache_used = 36 M
Current query_cache_limit = 4 M
Current Query cache Memory fill ratio = 57.78 %
Current query_cache_min_res_unit = 4 K
MySQL won't cache query results that are larger than query_cache_limit in sizeSORT OPERATIONS
Current sort_buffer_size = 2 M
Current read_rnd_buffer_size = 1020 K
Sort buffer seems to be fineJOINS
Current join_buffer_size = 4.00 M
You have had 46 queries where a join could not use an index properly
join_buffer_size >= 4 M
This is not advised
You should enable "log-queries-not-using-indexes"
Then look for non indexed joins in the slow query log.OPEN FILES LIMIT
Current open_files_limit = 65535 files
The open_files_limit should typically be set to at least 2x-3x
that of table_cache if you have heavy INNODB usage.
Your open_files_limit value seems to be fineTABLE CACHE
Current table_cache value = 32512 tables
You have a total of 862 tables
You have 675 open tables.
The table_cache value seems to be fineTEMP TABLES
Current max_heap_table_size = 23 M
Current tmp_table_size = 32 M
Of 501164 temp tables, 17% were created on disk
Effective in-memory tmp_table_size is limited to max_heap_table_size.
Created disk tmp tables ratio seems fineTABLE SCANS
Current read_buffer_size = 1 M
Current table scan ratio = 2462 : 1
read_buffer_size seems to be fineTABLE LOCKING
Current Lock Wait ratio = 1 : 10845
Your table locking seems to be fine
Add new comment